The Cray Programming Environment (CPE) includes the Cray Performance Measurement & Analysis Tools (CPMAT) suite. This article provides brief descriptions of the two CPMAT tool sets, Cray Perftools (a set of performance data collection tools) and Apprentice2 or Apprentice3 (a visualization tool), together with the associated Perftools modules, usage examples, and sample performance analysis results in text and graphics formats.
Cray Perftools
Cray Perftools (also known as PAT or CrayPat) is a core data capture tool within CPMAT. It can analyze whole program performance across many nodes, use Performance API (PAPI) to interface with Cray system's hardware performance counters, and perform either sampling or tracing experiments.
Note: Sampling collects data periodically based on expiration of a timer or overflow of a hardware counter. Tracing records detailed time-sequenced information of instrumented functions or regions.
TIP: Tracing a large, long-running program can incur considerable overhead.
Instrumentation Approaches
This section describes three ways of instrumenting applications (namely, at run-time, compile-time or link-time) to enable performance data collections with CrayPat. Different instrumentations require loading one or more of the Perftools modulefiles shown in this module avail perftools output:
See the Perftools Modules section for a brief description of each of these modules.
Note: To avoid interference with CrayPat, do not use other tools that also do performance analysis (for example, the NAS-developed mpiprof tool) at the same time as CrayPat.
Run-Time Instrumentation
This is CrayPat's simplest and recommended approach for starters. It hides the complexity of Craypat's classic approach which uses the pat_build utility for a link-time instrumentation. With this approach, you can choose to use your existing un-instrumented executable without recompiling and relinking and will be able to perform some basic sampling performance analysis via the pat_run utility accessible through the perftools-base module.
On the other hand, you can also choose to relink your executable with the perftools-preload module loaded which allows the resulting executable to facilite the use of the LD_PRELOAD environment variable during execution with the pat_run utility and access nearly all the performance analysis features that would typically require explicit instrumentation via pat_build.
In addition, pat_run supports Python tracing and sampling experiments while pat_build does not. Read man pat_python for more information. Some high-level differences between pat_build and pat_run are included in man pat_run.
TIP: We recommend that you build your executable using the -g compiler flag in order to allow the source line numbers to be shown in the performance analysis report.
There are multiple options for the pat_run utility to choose different sampling or tracing experiments. A few of the pat_run options are listed here. Read man pat_run for more information and see this example for a demonstration.
Compile-Time Instrumentation
This is CrayPat's simplified (compared to the classic link-time approach), lightweight and automatic reporting approach. Recompiling/linking is needed to create an instrumented executable.
WARNING: If you have an existing un-instrumented executable with the same filename, it will be overwritten.
This approach requires loading only one of the following instrumentation modules (in addition to perftools-base) before compiling the application.
perftools-lite
For default time sampling profile.
perftools-lite-loops
For loop analysis where the performance data are to be used with Apprentice2/3 (must be used with the Cray Compiler).
perftools-lite-events
For event profile, such as tracing top functions, providing I/O information, and suggestion for rank reordering.
Note: The following two perftools modules do not apply to the NAS Turin nodes since they do not contain GPUs or high bandwidth memory (HBM):
perftools-lite-gpu
For tracing experiments that focus on the program's use of GPUs.
perftools-lite-hbm
For identifying program locations responsible for high bandwidth from memory (must be used with the Cray Compiler and Intel processors with HBM).
See this example for a demonstration. For limitations of using this approach, see the WARNINGS section of man perftools-lite.
Link-Time Instrumentation
This is CrayPat's classic approach. Recompiling is not needed if all the .o files exist, but relinking is required with the modules perftools-base and perftools loaded. In addition, the Cray compiler wrappers ftn, cc, and CC must be used during the link step. After instrumentation using the pat_build utility, it creates a uniquely instrumented stand-alone executable. The instrumented executable includes +pat appended to the end of the executable name. This approach provides more in-depth performance analysis and greater flexibility in controlling data collection.
A few of the pat_build options are listed here. See this example for a demonstration. For more information, read man pat_build for options and environment variables.
Notes:
If the application is instrumented as a tracing experiment, you must re-instrument the application to trace different or additional functions.
The pat_build utility does not support instrumenting programs written in Python.
CrayPat also provides an Application Program Interface (API) where CrayPat functions can be inserted into an application's source code. See man pat_api for more information.
Performance Reports
Depending on the method of instrumentation, options and run-time environment variables used (such as various PAT_RT_XXX variables), various reports or graphs can be generated by running pat_report or Apprentice2/3 (app2/app3) on data collected under an experiment_data_directory. The experiment_data_directory may include multiple subdirectories and files:
xf-files
A directory containing raw data written by the instrumented executable; processing the xf-files requires access to the instrumented executable. To save disk space, we recommend deletiing this subdirectory after the ap2-files subdirectory has been generated.
ap2-files
A directory containing data to be used with Apprentice2 or Apprentice3 (or pat_report to generate a text report). Automatically generated after first invocation of pat_report on the experiment_data_directory.
rpt-files
A directory containing a copy of the text report; automatically generated at the end of a run if the executable was instrumented at (i) run-time using pat_run with the -r option of pat_run, (ii) compile-time using one of the perftools-lite-xxx modules, and (iii) link-time using pat_build with the -D report=y option of pat_build.
build-options.apa
A file generated when performing an Automatic Profiling Analysis (for applications instrumented with pat_build, which by default includes -O apa ) with results processed by pat_report; contains the pat_build arguments recommended for further performance analysis with pat_build -O experiment_data_directory/build-options.apa.
(One or more) MPICH_RANK_ORDER_FILE files
Contain suggestions for optimizing MPI rank placement.
In addition, pat_report, a first-level data analysis tool available through the perftools-base module, can be used to process the xf-files, create text reports, and export data for additional analysis. See a sample text report below. Read pat_report -h and man pat_report to learn its many options and environment variables. The utility pat_info is used to generate a quick summary of the contents of the experiment_data_directory.
Cray Apprentice2/3
Apprentice2 or Apprentice3 (app2 or app3) is a graphical user interface (GUI) for visualizing and analyzing performance data. It is a second-level data analysis tool available through the perftools-base or the perftools module. Compared to Apprentice2, Apprentice3 provides enhanced scalability, an improved user interface, and advanced metrics for more detailed and efficient performance analysis. Apprentice3 can help to identify load imbalance, excessive serialization, and excessive communication and network contention. It can also provide call-graph-based profiling information with source code mapping and time-based tracing.
Note: The Cray Programming Environment version 25.09 installed on Athena provides only Apprentice3.
Performance raw data in .xf format cannot be processed by app2/3. Use pat_report to convert .xf to .ap2 format first.
To reduce latency, download one of the following Cray Apprentice3 clients from /opt/cray/pe/perftools/25.09.0/share/desktop_installers on Athena and install on your local machine:
Apprentice3Installer-25.09.0-5.dmg (for MacOS)
Apprentice3Installer-25.09.0-5.exe (for Windows OS)
Then, use the Apprentice3 GUI locally to analyze performance data collected on the NAS compute nodes.
Perftools Modules
This section provides a brief description of some of the Perftools modules that are located in /opt/cray/pe/perftools/25.09.0/modulefiles.
perftools-base
This is CrayPat's fundamental module. Loading it provides access to:
Man pages (such as app3, intro_craypat, intro_papi, papi_counters, pat_api, pat_build, pat_report, pat_run, pat_info, pat_help, pat_view, pat_python, perftools-base, perftools-lite, etc.).
help systems, such as pat_help.
PAPI.
Utilities such as pat_run, pat_build, pat_report and many other pat_xxx.
Apprentice3.
Additional instrumentation modules such as perftools and perftools-lite-xxx visible through the command module avail perftools.
This module does not add compiler flags and will not alter the program's behavior. It can be left loaded even when building and running programs without CrayPat instrumentation. It can remain loaded for access to Apprentice3.
WARNING: In addition to perftools-base, only one of the other perftools module described below should be loaded.
perftools-preload
Loading this module will use the environment variable LD_PRELOAD to instrument and collect performance data at runtime using the pat_run utility.
perftools-lite and other perftools-lite-xxx
Load one of these modules prior to compiling the program. When execution is completed, a text report is written to the stdout file in addition to data under the experiment_data_directory.
perftools-lite
Performs a sampling experiment with a text report including the execution time, aggregate MFLOP count, top time-consuming functions and routines, and MPI behavior in the user's program.
perftools-lite-events
Performs a tracing experiment with a text report of a profile of the top functions traced and node observation, and possible rank order suggestions.
perftools-lite-loops
Performs a tracing experiment focusing on estimating loop performance. After program execution completes, a performance data file (.ap2) is produced for use with Apprentice3.
perftools
This includes a collection of CrayPat libraries for collecting and recording performance data. It enables instrumentation with full access to CrayPat functionality. Load this module, then use pat_build to instrument and pat_report to process the data collected and generate reports.
Perftools Usage Examples
To access man pages or the help system:
% module load perftools-base
% man intro_craypat
% pat_help
% pat_help FAQ
% pat_help all . > get_help_and_exit.txt
To use the pat_run approach—which allows a run-time instrumentation using either your existing executable or a new executable created during link-step with the perftools-preload module loaded—do the following:
Note: If you want the performance analysis report to include source line numbers, your executable must be built with the -g compiler flag.
% module use /opt/cray/pe/perftools/25.09.0/modulefiles
% module load perftools-base

Optional:
% module load perftools-preload           # for relinking to create a new executable

- Do the link step (assuming you have the *.o)
  to allow the new executable to access nearly all
  the performance analysis features.
  Without this step, pat_run can still be used, but it can
  only provide a limited set of instrumentation features,
  primarily basic sampling.
End_of_optional

% module use /opt/cray/pals/modulefiles
% module load cray-pals
% mpiexec [mpiexec options] pat_run [pat_run options] your_executable
CrayPat/X:  Version 25.09.0 ...
...
Experiment data directory written:
/path/to/experiment_data_directory        # xf-files subdirectory generated under this directory

% pat_report experiment_data_directory    # This generates ap2-files subdirector
The following are some pat_run options. Without any option, the default is to do a sample call stack over time (samp_cs_time) experiment.
-E events
Specifies performance counters. For example:
-E "PAPI_TOT_CYC,PAPI_TOT_INS,PAPI_TLB_DM,PAPI_FP_OPS", -E default, or -E 0,
which have the same effect of collecting data for the PAPI_TOT_CYC,PAPI_TOT_INS,PAPI_TLB_DM,PAPI_FP_OPS counters.
-E fp_stats collects data for the PAPI_TOT_CYC,PAPI_TOT_INS,RETIRED_FP_OPS_BY_TYPE:SCALAR_ALL,
RETIRED_FP_OPS_BY_TYPE:VECTOR_ALL
-E "PAPI_TOT_CYC,RETIRED_FP_OPS_BY_WIDTH:PACK128_UOPS_RETIRED,
RETIRED_FP_OPS_BY_WIDTH:PACK256_UOPS_RETIRED,RETIRED_FP_OPS_BY \
_WIDTH:PACK512_UOPS_RETIRED", to see whether the retired floating-point operations in your run are dominated by 128, 256, or 512 bit vector operations.
Notes:
One of the -E lines listed above is too long to be formatted as one line, so it is broken with a backslash (\).
You can also set the environment variable PAT_RT_PERFCTR instead of using the -E option.
-g group-names
Traces all functions that belong to group names, such as mpi, omp, blas, lapack, fftw, hdf5, netcdf, heap, io, lustre. See -g option of man pat_build for a full list.
TIP: After the experiment has been completed, use pat_report -s traced_functions=show experiment_data_directory to see the traced functions called.
-r
Automatically generates a text report (under the rpt-files subdirectory of experimen_data_directory) at the end of a run.
-s sampling-spec
Performs a sampling experiment with the given specification. For example, -s cs,time will capture the entire call stack using a time interval to trigger a sampling interrupt, while -s pc,time will capture the program address instead of the call stack.
-t
Records a full trace of performance data, whether the data is collected by sampling or tracing. See man intro_craypat for an explanation of the terminology. This option provides a convenient way to set PAT_RT_SUMMARY to 0.
-w
Performs a tracing experiment.
TIP: To do a tracing experiment of a group of functions, such as mpi, and avoid summarizing performance data that leads to losing detailed trace information, use -w -t -g mpi.
To do a lightweight time sampling profiling, which does a compile-time instrumentation:
% module use /opt/cray/pe/perftools/25.09.0/modulefiles
% module load perftools-base
% module load perftools-lite
% module load PrgEnv-xxx
         # Load the module with your choice of compiler
Compile and link the program to generate an instrumented executable. For example:
% ftn [options] -o your_executable your_program.f
% module use /opt/cray/pals/modulefiles
% module load cray-pals
% mpiexec [mpiexec options] ./your_executable
CrayPat/X:  Version 25.09.0 ...
..
# A text report is generated together with experiment_data_directory.
#######################################
#                                     #
# CrayPat-lite Performance Statistics #
#                                     #
#######################################
....
For a complete report with expanded tables and notes, run:
pat_report /path/to/experiment_data_directory

% pat_report /path/to/experiment_data_directory

% module unload perftools-lite
     # to prevent further instrumentation in a later build
To use the pat_build approach, which does a link-time instrumentation:
If the *.o files of your application are no longer available, recompile with the -c option. For example:
% ftn -c [compiler options] your_program.f
     # This generates your_program.o
% ftn -o your_executable your_program.o
     # This must be done with the module perftools loaded
Note: The Cray compiler wrappers (ftn, cc, CC) must be used during the link step in order to use with pat_build. Otherwise, pat_build will fail with this message:
ERROR: Missing required ELF section '.note.link' from the program ...
% pat_build [pat_build options] your_executable # This instruments your_executable
                                                # and generates your_executable+pat
% module use /opt/cray/pals/modulefiles
% module load cray-pals
% mpiexec [mpiexec options] ./your_executable+pat
CrayPat/X:  Version 25.09.0 ...
...
Experiment data directory written:
/path/to/experiment_data_directory              # The directory contains xf-files

% pat_report /path/to/experiment_data_directory # This generates a text performance output
                                                # and creates the ap2-files directory
                                                # may also create a *.apa file
% app3 /path/to/experiment_data_directory       # Use app3 GUI to analyze performance
If the experiment_data_directory contains a build-options.apa file that includes recommended arguments for further performance analysis, then use the following to generate your_executable+apa:
With this new instrumented executable, you can perform further analysis with the following:
% mpiexec [mpiexec options] ./your_executable+apa
Here are some pat_build options to consider:
-g group_names
Traces all functions that belong to group_names.
-t trace-file
Traces all functions listed in the trace-file.
-u
Traces functions defined by user in the program source files. This analysis is not available with pat_run.
-w
Makes tracing the default experiment.
-D report=y
Automatically generates reports at the end of the run.
-O apa
apa stands for automatic profiling analysis; this is the default if neither a sampling nor a tracing experiment is specified. It first profiles the application for time usage, and it generates output in a template file (*.apa) which shows suggested pat_build options for subsequent performance analysis.
-S
Runs a sampling experiment; good for finding what functions are most time consuming. This option can not be used together with other options that do tracing experiments, such as -g, -t, -u, -w, -T.
-T function_name
Instruments a specific function. This analysis is not available with pat_run.
Some environment variables to consider for pat_build:
PAT_RT_EXPERIMENT
For example, export PAT_RT_EXPERIMENT=samp_cs_time lets you perform a sampling of call stack over time. Note that sampling the call stack reveals the sequence of funtion calls (by capturing a series of memory addresses) that led to that location. Other choices, as seen in the output of the pat_help experiment topic, include:
samp_pc_time
This experiment samples the Program Counter (PC) at specific time intervals, where a program counter is a special CPU register that holds the memory address of the next instruction to be executed.
samp_cs_ovfl
This experiment captures call stack information when a hardware counter overflows. Setting a counter and an overflow threshold is required for this experiment. Below are two examples:
export PAT_RT_PERFCTR=PERF_COUNT_HW_CPU_CYCLES@1000000
or
export PAP_RT_PERFCTR=PAPI_FP_OPS@10000
samp_pc_ovfl
This experiment captures data based on the overflow of PC.
trace
This experiment requires the program be instrumented to trace a specific set of functions.
PAT_RT_PERFCTR
Run papi_avail to see the PAPI preset events. Up to four counters can be specified. For example:
export PAT_RT_PERFCTR="PAPI_FP_OPS,PAPI_TOT_INS"
     ## lets you instrument floating-point operations and total instructions executed.
     ## You can also
     ## choose a predefined counter number.

export PAT_RT_PERFCTR=0
     ## will instrument PAPI_TOT_CYC, PAPI_TOT_INS, PAPI_TLB_DM, and PAPI_FP_OPS

export PAT_RT_PERFCTR=1
     ## will instrument PAPI_TOT_CYC, PAPI_TOT_INS, PAPI_BR_INS, and PAPI_BR_TKN

export PAT_RT_PERFCTR=fp_stats
     ## will instrument PAPI_TOT_CYC, PAPI_TOT_INS, RETIRED_FP_OPS_BY_TYPE:SCALAR_ALL, and
     ## RETIRED_FP_OPS_BY_TYPE:VECTOR_ALL
Read man hwpc for more information.
PAT_RT_SUMMARY
Controls runtime summarization. When set to 1 (default), it summarizes/aggregates data, leading to smaller files. When set to 0, it disables summarization to capture detailed trace data.
PAT_RT_EXPFILE_PES
Specifies the individual PEs from which to collect and record data. Default: All PEs.
PAT_RT_TRACE_DEPTH
This variable lets you set the default maximum depth of the runtime call stack for traced function during runtime summarization. The default is 512.
For more choices of environment variables, see the output of the pat_help environment option.
Sample Text Report
This example demonstrates using a run-time instrumentation approach with pat_run. Specifically:
An executable named bt.B.x from the NAS Parallel Benchmarks (NPB) 3.4.2 was built.
The environment used during compile/link time was PrgEnv-cray with perftools-base loaded but not perftools-preload, perftools-lite-xxx or perftools.
The driver and compiler flag used were ftn -g.
Two nodes were used to run eight MPI processes per node.
The MPI processes were pinned using the --cpu-bind option of mpiexec.
The run was profiled with pat_run -r which will automatically provide a text summary file. This avoids the explicit step of using pat_report to process the raw data directory xf-files.
An experiment_data_directory named bt.B.x+NNNN-NNNNs was generated which contains the automatically generated directories xf-files, ap2-files, and rpt-files. NNNN-NNNNs is a sequence of numbers used to uniquely identify the run. The s at the end of the string indicates that this is from a sampling experiment.
Note: For tracing experiments, the name of the experiment_data_directory ends with t.
A high-level text summary of the performance analysis result was included in the file RUNTIME.rpt under the rpt-files directory.
The text file RUNTIME.rpt contains some information of the experiment details, such as the hardware, programming environment, number of MPI ranks or threads, how the executable was instrumented, runtime environment variables, and the experiment type and sampling interval:
The default text summary report of the samp_cs_time (sample call stack over time) experiment provides a glimpse of where the run spent most of its time, what functions and source line were heavily used, the imbalance between ranks, some statistics of four hardware counters, some I/O statistics, memory usage, process time, and memory high water mark by rank. For this run, high-level profiling results were divided into seven tables:
The value shown for Process HiMem is calculated from information in the /proc/self/numa_maps files captured near the end of the program. It is the total size of all pages (including huge pages) that were actually mapped into physical memory from both private and shared memory segments.
Table 7:  Wall Clock Time, Memory High Water Mark

  Process |   Process | PE=[mmm]
     Time |     HiMem |
          | (MiBytes) |

 6.431709 |     131.0 | Total
|-------------------------------
| 6.436082 |     129.7 | pe.1
| 6.430993 |     130.5 | pe.6
| 6.427668 |     134.1 | pe.9
|===============================
Note: This table shows only the maximum, median, and minimum PE entries, sorted by Process Time.
The data shown in the tables of a default output do not show rank-by-rank results. If a row does not display a PE (process) number, the data shown are the average of all ranks. If a PE number is displayed for a row, the data shown are either the maximum, minimum, or median of all ranks. To get rank-by-rank data for a specific table, you can run the following:
Read pat_report -s -h, pat_report -d -h, and pat_report -b -h to learn more on the output generated with pat_report -v.
The data collected in experiment_data_directory may contain more information beyond what is shown in the default summary report. You can try pat_report -O -h to see what options are available then try out some of the options. Keep in mind that not all options of -O are applicable to the data collected for a run. For example:
% pat_report -O -h
pat_report: Help for -O option:
Available option values are in left column, a prefix can be specified:

D1_D2_observation        D1 + D2 cache utilization
D1_D2_util               Functions with low D1+D2 cache hit ratio
D1_observation           D1 cache utilization
D1_util                  Functions with low D1 cache hit ratio
...
calltree                 Calltree View by Function
calltree+hwpc            Calltree View by Function with Counters
calltree+src             Calltree View with Callsite Line Numbers
calltree+src+hwpc        Calltree View with Line Numbers and Counters
...
mpi_callers              MPI Message Stats by Caller
mpi_coll_callers         MPI Collective Message Stats by Caller
mpi_dest_bytes           MPI Sent Message Stats by Distance Sorted by Bytes
mpi_dest_counts          MPI Sent Message Stats by Distance Sorted by Counts
mpi_hy_rank_order        MPI Hybrid Rank Order
mpi_observation          MPI utilization
mpi_p2p_bytes            MPI P2P Message Bytes, Src to Dest
mpi_p2p_map              Mapping of MPI P2P Source PE and callstack to number of destination PEs
mpi_p2p_map_observation  MPI Collective Recommendations
mpi_p2p_recv_time        MPI P2P Message Receive Time, Src to Dest
mpi_p2p_send_time        MPI P2P Message Send Time, Src to Dest
mpi_rank_order           Metric-Based Rank Order
...
p2p                      Abbreviation for:  mpi_p2p_bytes,mpi_p2p_send_time,mpi_p2p_recv_time
...
For this bt.B.x example, the following two commands with the options calltree and p2p did generate reports which provide a calltree view by function and statistics of p2p, which include data on mpi_p2p_bytes, mpi_p2p_send_time, mpi_p2p_recv_time.
On the other hand, the experiment_data_directory from this experiment does not have data on functions with low D1 cache hit ratio; therefore, the following command produced an error:
pat_report -O D1_util dir.a

### Error: 'D1_cache_hit_ratio not valid in -d option, or has no data'
TIP: Instead of trying out different options displayed by the command pat_report -O -h, it is easier to use the app3 tool which automatically generates texts or graphs of all data collected from the run.
Sample Graphs from Apprentice3
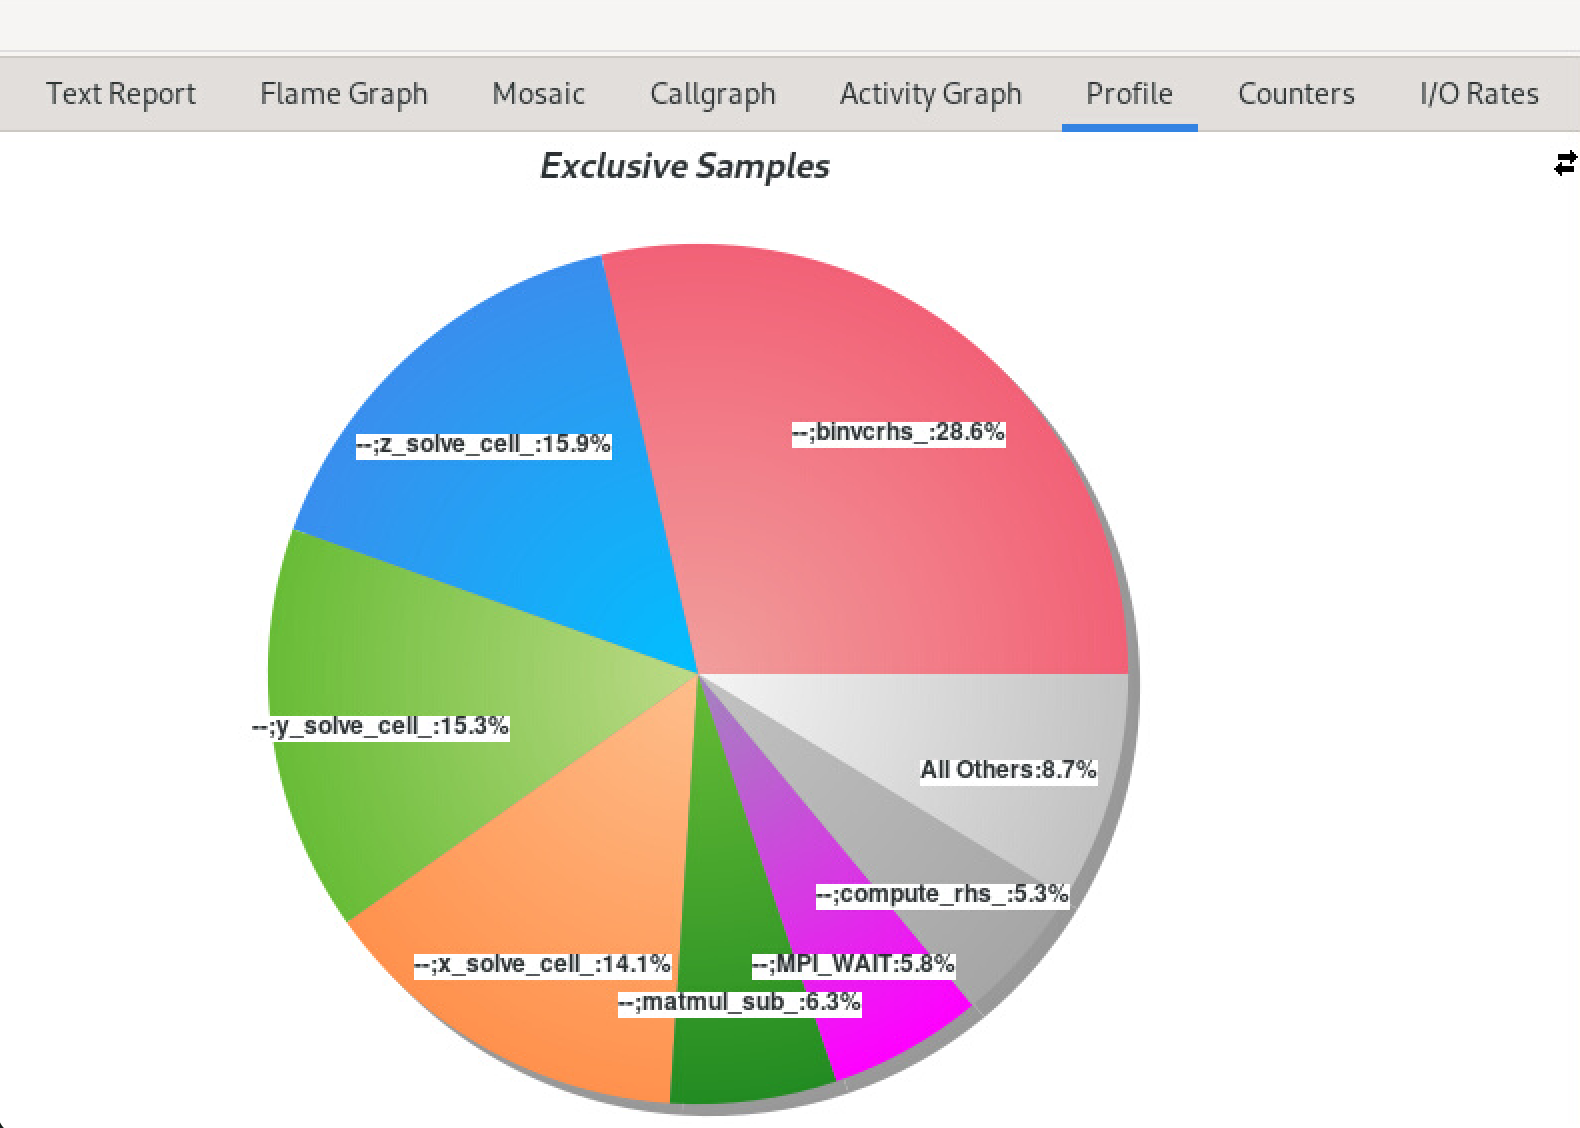
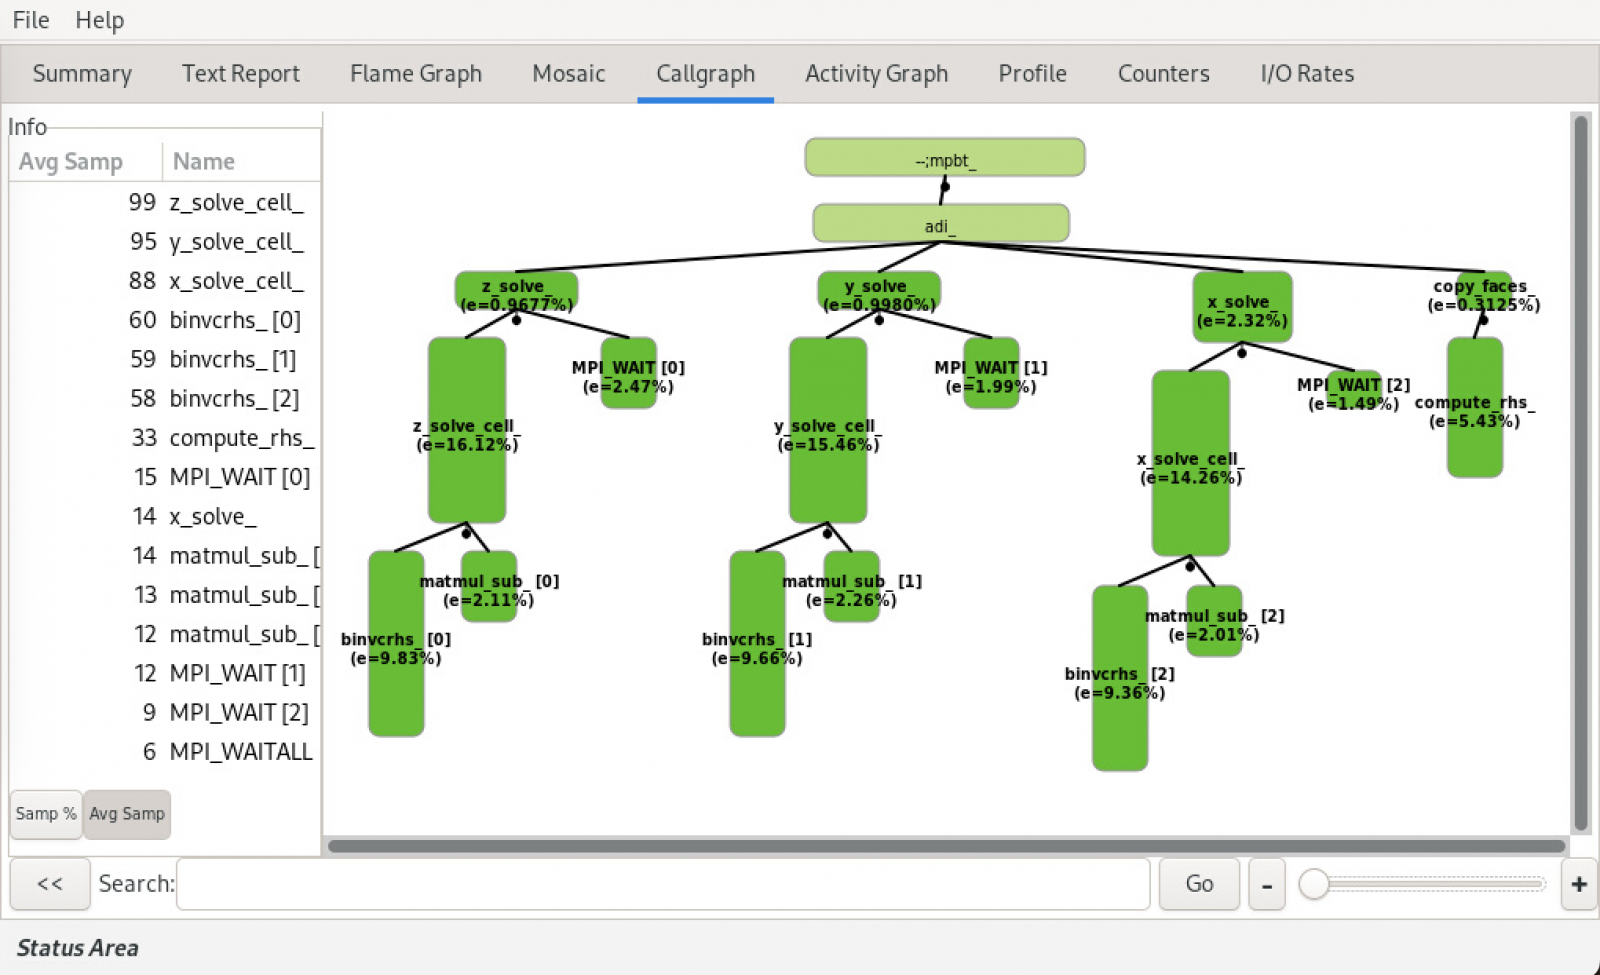
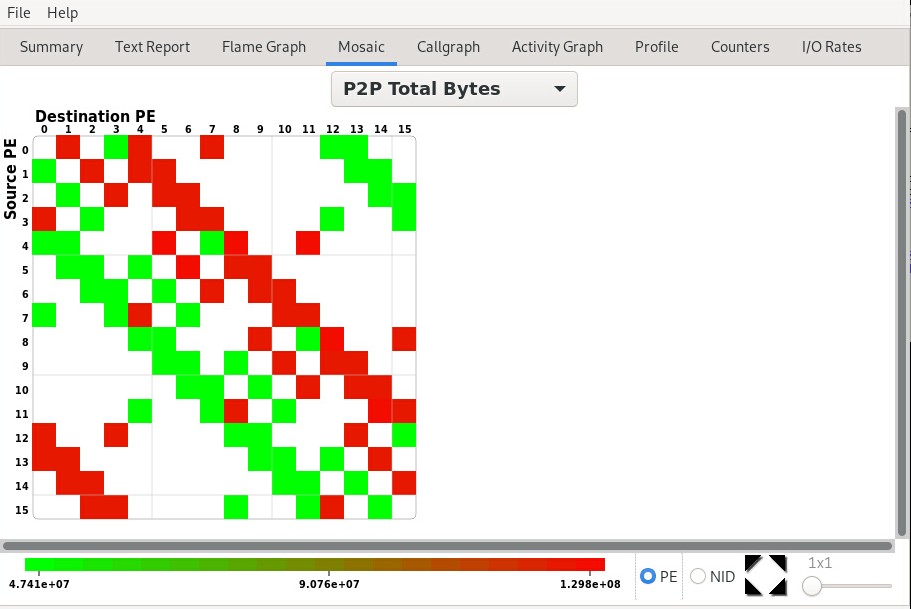
The Apprentice3 visualization tool allows you to visualize, explore, and analyze performance data captured. From the Text Report pulldown menu, you can select text reports for various options (such as those shown in the seven tables above and also some which are not included in the default). In addition, graphical presentation of some reports may be available from other pulldown menus.
For example, for the same run shown in the Sample Text Report, this image displays the percentage of samples collected from various functions in a pie chart from the Profile pulldown menu:
This image illustrates a callgraph (with the percentage of samples collected in each function) from the CallGraph pulldown menu:
Another image shows the P2P Total Bytes from the Mosaic pulldown menu: