NASA User Videos
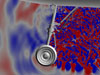
- Nose Landing Gear Surface Pressure Fluctuations
- Fluctuating pressures on nose landing gear surface showing regions of elevated pressure amplitude, or noise source locations.
- Mehdi Khorrami, Airframe Noise Team, NASA/Langley; Patrick Moran, NASA/Ames
- Radiated Acoustic Field
- Pressure contours showing hydrodynamic pressure fluctuations in the nose landing gear wake and the radiated acoustic field.
- Mehdi Khorrami, Airframe Noise Team, NASA/Langley; Patrick Moran, NASA/Ames
- Test-Particle Trajectories Around a Spinning Black-Hole Binary
- Velocity tracks of 75 thousand test particles, initially in close Keplerian orbit around the center of mass of a high-spin (a/M = 0.8) black-hole binary.
- Chris Henze, NASA/Ames
- Sunspot Pore Evolution
- Evolution of a large pore, or small sunspot, as seen in the emergent intensity over a 75-minute period.
- Ake Nordlund, Niels Bohr Institute; Robert Stein, Michigan State University
- Magnetic Flux Emergence
- This video shows the rise of magnetic field through the near-surface layers of the solar convection zone. The images represent the magnetic field strength (kG), and the arrows show the fluid velocity.
- Robert Stein, Michigan State University
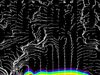
- Alfven Waves in the Solar Atmosphere
- Magnetohydrodynamic simulation from the solar convection zone (bottom) through the transition region (yellow-blue) to the corona. The atmosphere is permeated by magnetic fields (red lines) that sway back and forth, carrying enough energy from the engine of the convection to accelerate the solar wind.
- Mats Carlsson, University of Oslo, Norway
- Formation of a Jet in the Solar Chromosphere
- This video shows the formation of a violent jet formation (spicule) and related hot loop in the solar chromosphere. Red indicates temperatures at 1.3 million Kelvin (K), yellow is 100,000 K. Also shown are upflows of 45 kilometers per second (blue) and strong heating (green). Note the field lines on either side of magnetic discontinuity (red, purple). The photospheric magnetic field, By, is shown in greyscale.
- Juan Martinez Sykora, Lockheed Martin Solar & Astrophysics Laboratory
- Transition Region and Coronal Heating and Dynamics
- Simulated emission of two spectral lines formed at 70,000 kelvin (K, red) and 1 million K (blue). The transition region located some 2,000 kilometers (2 megameters) above the photosphere experiences violent dynamics as the corona above is heated.
- Viggo H. Hansteen, University of Oslo, Norway
- 20 days of clouds from GOES and GEOS-6 in February 2010
- Clouds as seen via infrared imagery from a 5-km GEOS-5 simulation (bottom) with observations from the GOES satellite (top) for 20 days in February 2010. Two massive winter storms move across north America, while deep convective clusters develop throughout the tropics.
- William Putman, NASA/Goddard
- GEOS-5 Modeled Clouds at 5-Kilometer Resolution
- Using the "cubed-sphere" version of the NASA Global Modeling and Assimilation Office's GEOS-5 model, a 5-kilometer-resolution global simulation captured the massive snowstorms that hit the eastern United States in February 2010.
- William Putman, Max J. Suarez, Greg Shirah, NASA/Goddard