
Authors: David L. Kao, William M. Chan, Chase P. Ashby
Version: 4.0
Date: September, 2025
Figure 1. An executive summary page generated by OVERSMART.
By default, OVERSMART will attempt to load xmGrace as a Python package first. If this fails, then it will attemp to look for Gnuplot in the user's path. If neither xmGrace nor Gnuplot is available, then OVERSMART will not generate any plots. However, if Gnuplot is specified as the plotting package (-gnu), then OVERSMART will save the gunplot commands to gnuplot.inp.
setenv PYTHONPATH /home1/wmchan/chimera3.0/smart/binand add one of the following directories to your path:
/u/wmchan/chimera3.0/bin_dp
/u/wmchan/chimera3.0/bin_sp
oversmart
An executive summary page containing a user-customized set of plots can be displayed typing
oversmart -com command_filewhere command_file is a text file containing specifications of the customized plots (see below).
Specific history files, grid files, input parameter files can be read into OVERSMART via command line inputs. The full set of optional command line arguments for running OVERSMART is given below.
oversmart < -com command_file > : use the commands in the given command_file
          < -fomoid > : use FOMOCO ID instead of component name
          < -gnu > : use the Gnuplot plotting package
          < -grid overflow_grid_file > : use the given grid file
          < -gui > : run in gui mode and display results to the screen
          < -help > : print the command line options
          < -html html_file > : save the output plots to html_file (default filename is $rootname.html where $rootname is the root name of the run)
          < -inp overflow_input_file > : use the given OVERFLOW inp file
          < -maxgraph #> : maximum number of data plots in FOMOCO graphs
          < -nolegend > : do not display legends in FOMOCO graphs
          < -noscaletime > : do not scale the time step numbers in the time axis
          < -nskip n > : plot every n time step in residual plot (default=1)
	  < -root overflow_run_rootname > : use the given root name
          < -save > : save the temporary data files and a file named plotxmGrace, which generates the executive summary plots using the temporary data files.
	  < -timerange start:end > : use the specified time range in all plots (except histogram plots)
          < -verb > : run in verbose mode
	Data_Type Data_Values
	Plot_Type
	Group_Type Group_Values
	Plot Row # Column #
where
	Data_Type    = Resid, Turb, or Fomoco    (Resid=flow residuals, Turb=turbulence model residuals,
                                                         Fomoco=force/moment history)
	Data_Values  = SL2, SLI, QL2 or QLI       for the Resid and Turb data types
                              (SL2, SLI = L-2 and L-infinity norms of RHS,
                               QL2, QLI = L-2 and L-infinity norms of delta Q)
	             = Fomoco coefficient name(s) for FOMOCO data type (*)

	Plot_Type    = Histogram, Composite, Plain, or SubIterBar
                              (for Resid and Turb data types only; omit this line for Fomoco data type)

	Group_Type   = Grids         for Resid and Turb data types
                     = Components    for Fomoco data type
        Group_Values = Near, off-body, all, #, or #-# (e.g., 3, 6-12) for Resid and Turb data types
                     = all, #, or #-# (e.g., 3, 6-12) for Fomoco data type

        Plot         = (use keyword as is)
        Row #        = Row number of current plot (e.g., Row 2)
        Column #     = Column number of current plot (e.g., Column 3)
(*) The list of acceptable Data_Values for Fomoco Data_Type is given below (case insensitive):
	PRESSURE FORCE X, PRESSURE FORCE Y, PRESSURE FORCE Z,
        VISCOUS FORCE X, VISCOUS FORCE Y, VISCOUS FORCE Z,
        MOMENTUM FORCE X, MOMENTUM FORCE Y, MOMENTUM FORCE Z,
        PRESSURE LIFT FORCE, PRESSURE DRAG FORCE, PRESSURE SIDE FORCE,
        VISCOUS LIFT FORCE, VISCOUS DRAG FORCE, VISCOUS SIDE FORCE,
        MOMENTUM LIFT FORCE, MOMENTUM DRAG FORCE, MOMENTUM SIDE FORCE,
        MOMENT ROLL, MOMENT PITCH, MOMENT YAW, MASS FLOW RATE, ELAPSED CPU TIME,
        PRESSURE ROLL MOMENT, PRESSURE PITCH MOMENT, PRESSURE YAW MOMENT,
        VISCOUS ROLL MOMENT, VISCOUS PITCH MOMENT, VISCOUS YAW MOMENT,
        MOMENTUM ROLL MOMENT, MOMENTUM PITCH MOMENT, MOMENTUM YAW MOMENT,
        TOTAL FORCE X, TOTAL FORCE Y, TOTAL FORCE Z,
        TOTAL LIFT, TOTAL DRAG, TOTAL SIDE
The Plot_Type command specifies which type of graph to plot for flow and turbulence residuals:
Histogram, Composite, Plain, or SubIterBar. The Group_Type command indicates which grids or
components to plot. For Grids, a collection of grids can be plotted by specifying `Near' for
all near-body grids or 'Off-body' for all off-body grids. A specific set of grids can be prescribed
using individual numbers (e.g., 3,7,9), or number ranges (e.g., 6-12). Similar values can be used
to specify Components.
To avoid cluttering the graph, a maximum of 10 group value parts are allowed.
	Resid SL2
	Histogram
	Grids Near
	Plot Row 1 Column 1
	Resid SL2
	Composites
	Grids Near
	Plot Row 1 Column 1
	Fomoco Total FORCE X
	Components All
	Plot Row 1 Column 1
	Resid SL2
	SubIterBar
	Grids All
	Plot Row 1 Column 1
and r#c# is the position of the plot (row # column #) in the executive summary page. For example, the file "osm_fomo_r2c3" contains the force/moment coefficients data for the plot located at row 2 and column 3. The -nokeep command option can be used so that OVERSMART will not save these files.
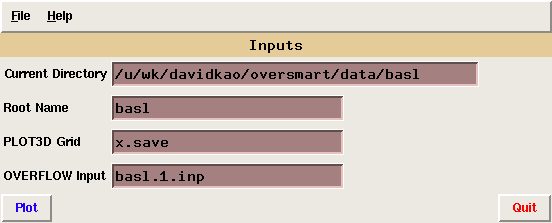
Figure 2. The main panel.
"Current Directory" is the name of the directory containing the run history files. The "Root Name" is the prefix of these history files. For example, if "Root Name"="basl", then OVERSMART will search for the following files: basl.resid, basl.turb, and basl.fomoco. "PLOT3D Grid" is the name of the grid file in PLOT3D format. For OVERFLOW runs, grid files are either grid.in or x.save. "OVERFLOW Input" is the flow solver input parameters file.
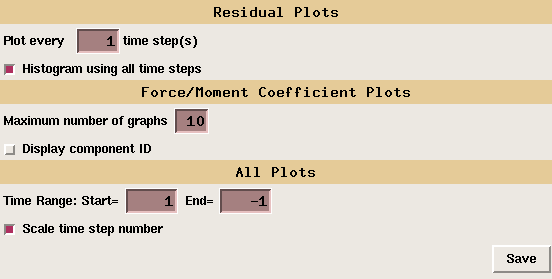
Figure 3. The preferences panel.
By default, OVERSMART plots every time step in the residual plot. User can override this default by specifing the "NSKIP" value in "Plot every NSKIP time step". This is very useful to take a quick look of the residual history files when there are thousands of time steps in these files. The Histogram plots are generated based on every time step in the residual history file. However, users may use those residuals from the every "NSKIP" time step by unselecting the option "Histogram using all time steps".Two attributes of the Force/Moment coefficient plots can be specified. The first attribute is the maximum number of graphs that can be displayed. The second attribute specifies whether to display the components by its name or by its ID in the legend.
For all plots, users can specify the range of time steps to be displayed on the graph by specifying the starting and the ending time steps. If the time step numbers are large (e.g., greater than 10,000), then the tick labels on the time axis can be cluttered. To reduce the cluttering of the tick labels, OVERSMART will scale the time step numbers (default). To disable this feature, users can unselect the "Scale time step number" check button.
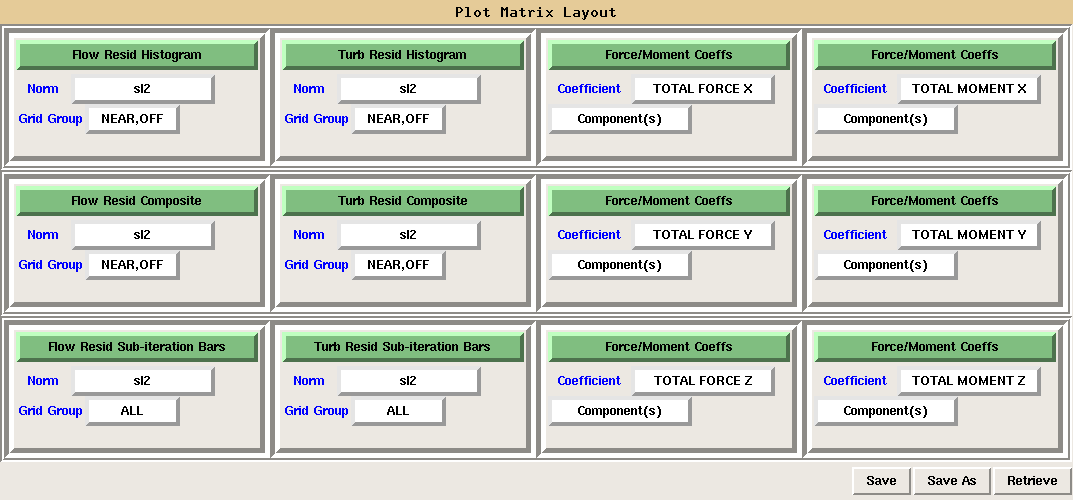
Figure 4. The command panel.
OVERSMART displays a matrix of plots for the executive summary page. For each sub-plot in the summary page, users can easily change the type of graph and the associate data variable to plot. Users can also save and retrieve previously saved summary page templates.Limitations - The graphs displayed in the GUI viewing window normally do not have the same quality as those generated in the batch mode. For report quality plots, batch mode is recommended. The GUI mode in this version is a preliminary version and there may be some bugs/errors. Please report all bugs/erros and suggestions for improvement.
	Resid SL2
	Grid Near, Off
	Histogram
	Plot Row 1 Column 1
	Turb SL2
	Grid Near, Off
	Histogram
	Plot Row 1 Column 2
	Fomoco TOTAL FORCE X
	Component All
	Plot Row 1 Column 3
	Fomoco TOTAL MOMENT X
	Component All
	Plot Row 1 Column 4
	Resid SL2
	Grid Near, Off
	Composites
	Plot Row 2 Column 1
	Turb SL2
	Grid Near, Off
	Composites
	Plot Row 2 Column 2
	Fomoco TOTAL FORCE Y
	Component All
	Plot Row 2 Column 3
	Fomoco TOTAL MOMENT Y
	Component All
	Plot Row 2 Column 4
	Resid SL2
	Grid All
	SubIterBar
	Plot Row 3 Column 1
	Turb SL2
	Grid All
	SubIterBar
	Plot Row 3 Column 2
	Fomoco TOTAL FORCE Z
	Component All
	Plot Row 3 Column 3
	Fomoco TOTAL MOMENT Z
	Component All
	Plot Row 3 Column 4
Last modified: September 10, 2025